
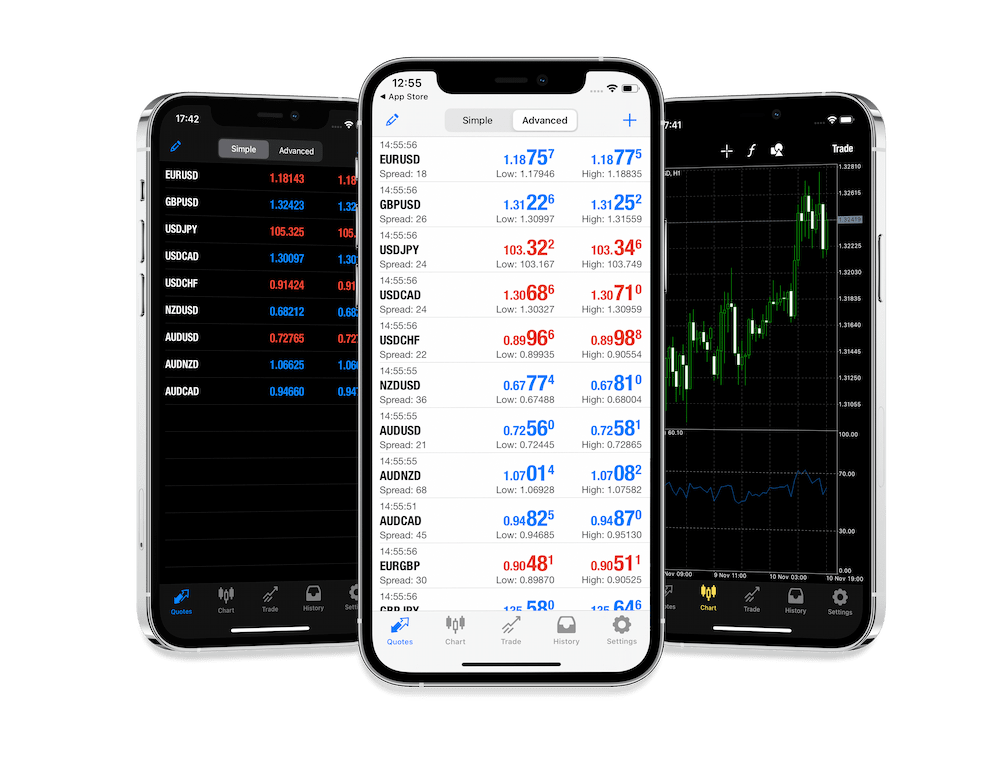
The pressure is on if you’re trading in a prop firm environment. You have goals to achieve, regulations to stick to, and risks to expertly manage. The worst part is that the majority of traders are obsessed with a single chart, period, and setup. And that’s where many of them go wrong, my friend. How can you hope to see the entire picture if you’re only examining one piece of the puzzle?
Multi-timeframe analysis or MTFA is useful in this situation. Driving through a foggy mountain road while on high beams gives you a lot more clarity. Additionally, you have all the tools you need to succeed while using a platform like mMT5. Let’s take a look at what MTFA is, why it’s so important to prop firm traders, and how to use it on MT5 to make more informed, quicker, and more secure trading decisions.
What the Heck is Multi-Timeframe Analysis?
In simple terms, multi-timeframe analysis is the process of examining the same market for example, EUR/USD over a variety of timeframes, such as the 1-minute, 1-hour, 4-hour, and daily charts, to obtain a more comprehensive understanding of the price’s movements. To avoid traps, identify reversals, and capture trends, you are essentially zooming in and out.
Imagine it as Google Maps. All you can see when you zoom in too closely is the next turn. However, you can see the entire route, any traffic, and possibly even a shortcut if you zoom out a little. The same is true for charts.
A solid MTFA setup might look like this:
- Higher timeframe: Sets the overall trend and context e.g., daily or 4H.
- Middle timeframe: Helps with trade planning and refining entries e.g., 1H.
- Lower timeframe: Used for sniping entries or managing exits e.g., 15M or 5M.
If you’re in a prop firm challenge or managing a funded account, MTFA can literally be the difference between blowing the account or hitting payout.
Why Prop Firm Traders Should Care About MTFA
Strict Risk Rules
Most prop firms won’t tolerate sloppy entries. If you’re trading off a 1-minute chart without knowing what’s happening on the higher time frames, you’re playing a dangerous game. MTFA keeps you aligned with the bigger picture so you’re not trading against the trend like a deer in headlights.
Better Entries, Tighter Stops
Finding important levels such as support, resistance, or trendlines on a longer timeframe and then lowering them for a precise entry gives you the best of both worlds: context and accuracy. As a result, you may set tighter stops and allow trades to breathe, which is crucial for overcoming challenges or reaching strong profit targets.
Avoiding Whipsaws
Have you ever entered a trade that appeared ideal on the 15-minute chart only to be smashed by a 4-hour move? I’ve been there. By revealing the inner workings of the market, MTFA assists you in avoiding these trap trades.
Setting Up Multi-Timeframe Analysis on MT5
Step 1: Pick Your Timeframes
You don’t need to use all of them, just three is enough:
- Long-term: Daily or 4H
- Mid-term: 1H
- Short-term: 15M or 5M
With the strategic vision at the top, the tactical view in the middle, and the surgical accuracy at the bottom, this combination provides you with a well-rounded viewpoint.
Step 2: Open Multiple Chart Windows
In MT5, hit File > New Chart to open types of charts in MT5 as you need. You can then right-click the tab, choose Tile Windows, and boom, you’ve got all your time frames on display.
For easier navigation:
Color-code your charts. Maybe blue for the long term, orange for the middle, and green for the short term.
Label each chart window so you don’t get confused.
Step 3: Sync the Instrument
Make sure all charts are on the same pair or instrument. If you’re analyzing GBP/JPY, then all your windows should be showing that. MT5 doesn’t automatically sync them, so you’ve got to manually switch if you change instruments.
Step 4: Use Vertical Lines to Mark Events
One of MT5’s best tricks? If you link the charts using templates or Expert Advisors, a vertical line that appears on one will appear on the others. This is incredibly useful for identifying pivotal occasions across all timeframes, such as when the price responds to a level.
How to Actually Use MTFA in Real Trades
Now here’s where the rubber meets the road. Let’s say you’re looking at EUR/USD and want to find a solid long trade. Here’s how MTFA would help you break it down:
Step 1: Start Big – Daily or 4H
Check the trend. Is the pair making higher highs and higher lows? Cool, then the bias is bullish. Also, look for major support and resistance levels. Maybe the price is bouncing off a key daily support zone.
Step 2: Zoom In – 1H
Now you’re scouting for a setup. Has the price pulled back to a support area? Is there a bullish engulfing candle or a strong reversal signal?
You’re not pulling the trigger yet. You’re just watching how price behaves in that zone.
Step 3: Go Small – 15M or 5M
Here’s where you enter the sniper zone. You’re looking for an entry signal, a break of a trendline, a bullish pattern, or confirmation via your indicators.
Maybe you see an inverse head and shoulders form, or a quick consolidation breakout. Now’s your time to strike. You enter the trade with a tight stop just below the recent swing low, aiming for that 3:1 reward-to-risk sweet spot.